Point Cloud Processing with Open3D and Python
The field of 3D understanding has been attracting increasing attention in recent times, significantly propelled by AR and Spatial Computing technology, backed by major companies like Apple and Meta, with recent the launch of Apple’s Vision Pro.
At the heart of this fascinating field lies 3D computer vision, a specialized branch of computer vision that focuses on understanding and processing three-dimensional visual data from the real world.
Applications range from navigation systems in self-driving cars and operational algorithms in autonomous robots to immersive virtual and augmented reality experiences. Processing and interpreting three-dimensional information is key to these technologies’ development.
This article introduces 3D point cloud processing using Open3D library, an open-source library designed to empower developers and researchers with a comprehensive set of tools for 3D data processing. All these concepts will be explored through practical Python examples, providing a solid foundation for further exploration and application of 3D data processing skills.
Download the code
- All code published on 3D machine learning field can be found in the official GitHub repo.
- The code for this specific article can be found here.
Open3D: A Modern Library for 3D Data Processing
Open3D stands at the forefront of 3D data processing technology, offering an open-source library that significantly accelerates the development of software focused on handling 3D data. Designed with a clear and intuitive API, Open3D provides developers and researchers with easy access to a robust set of data structures and algorithms for 3D computing, in both C++ and Python.
The core features of Open3D are meticulously designed to cover every aspect of 3D data handling, including comprehensive support for 3D data structures and processing algorithms, essential for tasks such as scene reconstruction, surface alignment, and 3D visualization.
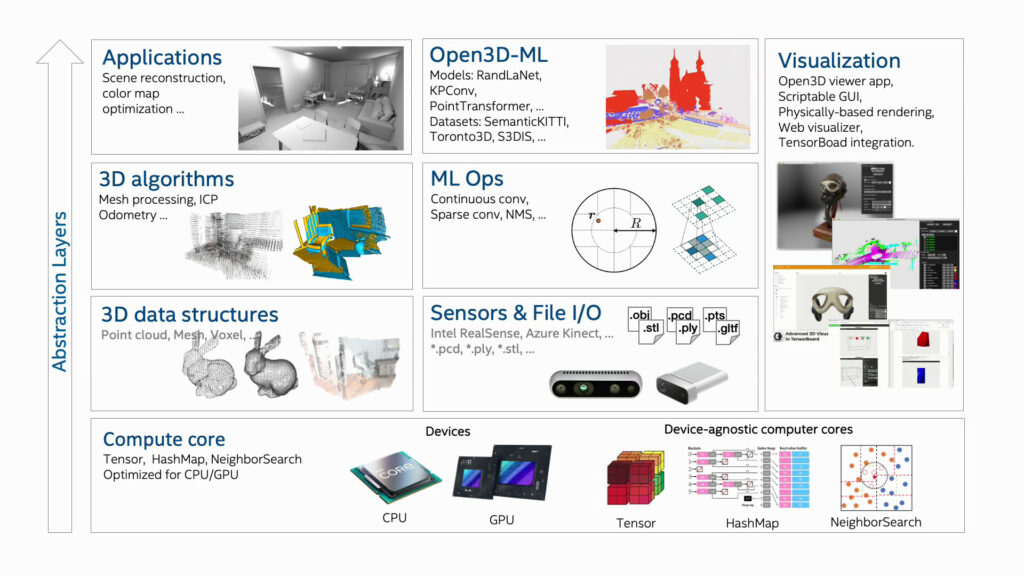
Moreover, the library goes beyond traditional processing capabilities by offering physically based rendering (PBR), which adds a layer of realism to 3D models, and support for 3D machine learning, allowing integration with popular frameworks like PyTorch and TensorFlow.
Open3D’s support for GPU acceleration significantly enhances the efficiency of core 3D operations, benefiting applications that require real-time processing and visualization of 3D data, such as interactive AR/VR experiences, robotics, and autonomous vehicle navigation.
3D Shape Representation Methods
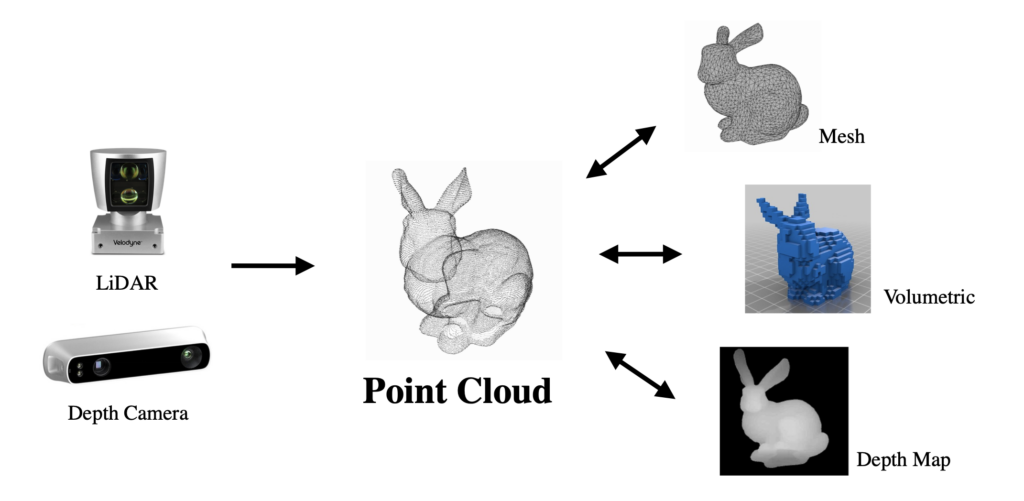
In 3D data processing, shapes are represented in two primary ways: rasterized and geometric forms.
Rasterized representations use regular grids and include multi-view images, depth maps, and volumetric data. Multi-view images capture objects from various angles, depth maps record the distance from a viewpoint to the object’s surfaces, and volumetric representations use a grid of voxels to model objects in 3D space.
Geometric representations, on the other hand, model shapes through irregular, discrete elements. This category includes polygonal meshes, which are composed of vertices, edges, and faces; point clouds, which are sets of vertices in a three-dimensional coordinate system; and primitive-based CAD models, which use geometric primitives (such as spheres, cubes, and cylinders) to construct complex shapes.
Each representation has its specific applications and advantages, with rasterized forms being useful for image-based 3D reconstruction and geometric forms offering precision in modeling and simulation.
Theoretical Foundations of Point Clouds
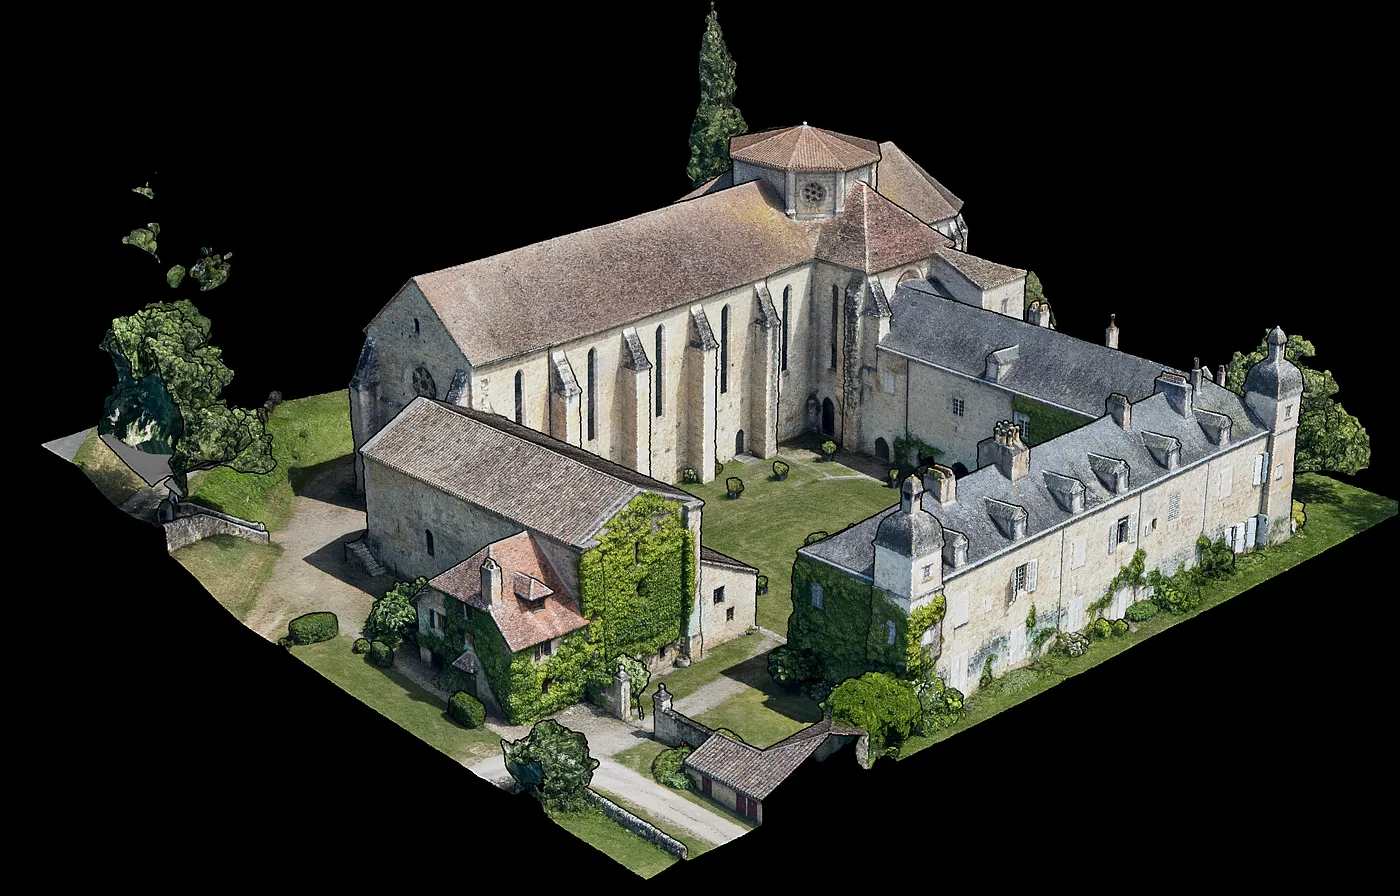
Point clouds are a fundamental form of surface representation, capturing the essence of objects in the form of discrete points distributed across their surfaces. Mathematically, a point cloud can be defined as a set  , where each
  represents a point in three-dimensional space with coordinates corresponding to its position.
This simplicity allows for the direct acquisition of spatial data from the environment, making point clouds an indispensable tool in fields such as computer vision, computer graphics, and robotics. The proliferation of affordable 3D sensors has further democratized access to point cloud data, enabling a wide range of applications from detailed environmental mapping to complex object recognition tasks.
Algorithms designed for point cloud processing often rely on spatial relationships and density variations within the data to infer surface properties and object boundaries. Techniques such as the construction of a k-d tree for efficient nearest neighbor search or the application of surface reconstruction algorithms like Poisson reconstruction or alpha shapes are commonly employed to derive meaningful interpretations from raw point cloud data.
Despite their simplicity, point clouds encapsulate a rich set of information about the geometry and topology of physical objects, serving as a critical bridge between the digital and physical worlds in numerous technological domains.
Python Quick Start with Open3D
In this section, we’ll dive into the basics of using Open3D, a powerful library for 3D data processing, focusing on point cloud visualization. Open3D simplifies the manipulation and visualization of 3D data, making it accessible for developers working across different platforms such as Ubuntu, macOS, and Windows with Python versions 3.8 to 3.11.
Installation and Verification
To get started with Open3D, you can install it using pip. There are two installation options available: a standard installation and a CPU-only version for x86_64 Linux systems, which is smaller and may be preferable for environments without a dedicated GPU.
pip install open3d       # Standard installation
pip install open3d-cpu   # CPU-only installation for Linux
After installation, it’s a good practice to verify that Open3D is correctly installed by checking its version. This can be done with a simple one-liner command in Python.
python -c "import open3d as o3d; print(o3d.__version__)"
Open3D also provides a Python API for 3D data processing and visualization, as well as a command-line interface (CLI) for executing predefined examples.
Visualizing a Point Cloud
The core of this tutorial focuses on loading and visualizing a point cloud using Open3D. The process begins with loading a .ply point cloud file, a popular format for storing 3D data. The read_point_cloud method is used for this purpose, which automatically decodes the file based on its extension.
import open3d as o3d
import numpy as np

# Loading and visualizing a PLY point cloud
print("Loading a PLY point cloud, printing, and rendering...")
ply_point_cloud = o3d.data.PLYPointCloud()
pcd = o3d.io.read_point_cloud(ply_point_cloud.path)

# Printing point cloud information and points array
print(pcd)
print(np.asarray(pcd.points))

# Setting visualization parameters
view_params = {
    "zoom": 0.3412,
    "front": [0.4257, -0.2125, -0.8795],
    "lookat": [2.6172, 2.0475, 1.532],
    "up": [-0.0694, -0.9768, 0.2024]
}

# Rendering the point cloud
o3d.visualization.draw_geometries([pcd], **view_params)
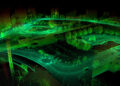
After loading the point cloud, we can inspect it by printing the pcd object and the array of points it contains. This provides a glimpse into the structure and data contained within the point cloud. The visualization is handled by the draw_geometries function. This powerful function renders the point cloud in a window, allowing users to interact with the 3D data. These parameters help in adjusting the camera’s perspective, offering a detailed view of the data structure post-downsampling.
The visualization might give the impression of a dense surface; however, it’s essential to remember that what we’re seeing is a point cloud rendered as surfels. Open3D’s GUI provides additional functionalities, such as adjusting the point size with keyboard shortcuts, enhancing the visualization experience. For instance, pressing the - key decreases the point size, offering a different perspective on the data.
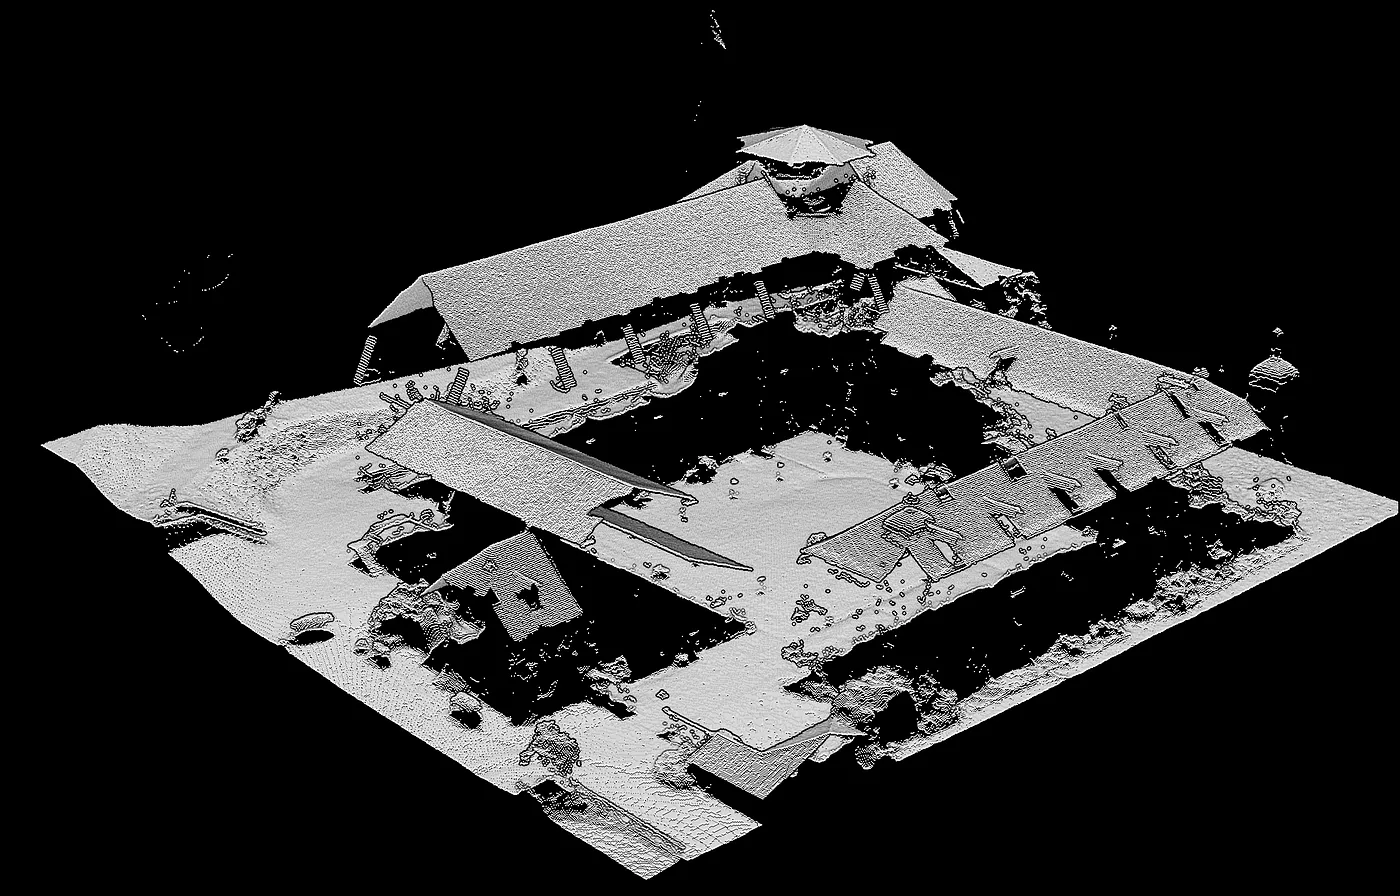
Voxel Downsampling
This process applies a voxel grid to uniformly downsample an input point cloud. It simplifies point cloud data for computational efficiency in further processing steps. The method operates by grouping points into voxels and then averaging the points in each voxel to a single location.
This reduces the number of points, maintaining the general shape and features of the original point cloud.
print("Downsampling the point cloud with a voxel size of 0.05")

# Applying voxel downsampling
downpcd = pcd.voxel_down_sample(voxel_size=0.05)

# Setting visualization parameters for the downsampled point cloud
downsample_view_params = {
    "zoom": 0.3412,
    "front": [0.4257, -0.2125, -0.8795],
    "lookat": [2.6172, 2.0475, 1.532],
    "up": [-0.0694, -0.9768, 0.2024]
}

# Rendering the downsampled point cloud
o3d.visualization.draw_geometries([downpcd], **downsample_view_params)
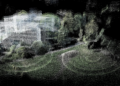
In the voxel downsampling code snippet, the process begins with specifying a voxel size of 0.05, which determines the resolution of the downsampling grid. The voxel_down_sample function is called on the original point cloud pcd, reducing its density by averaging the points within each voxel to a single point. This results in downpcd, a downsampled version of the original point cloud.
The o3d.visualization.draw_geometries function is then used to visualize downpcd. Parameters like zoom, front, lookat, and up are set to configure the viewing angle and position, providing a clear visualization of the downsampled point cloud.
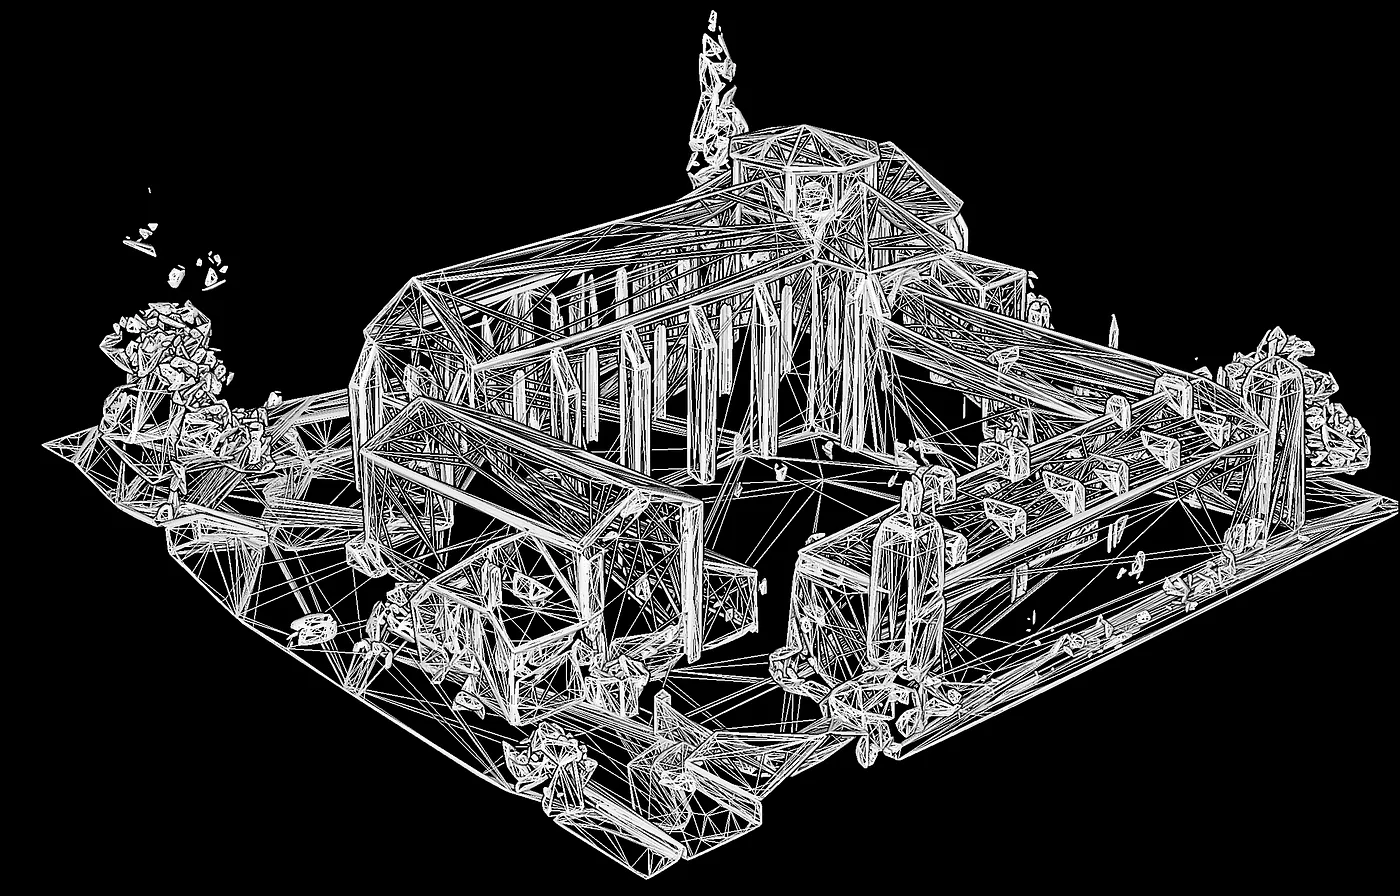
Vertex Normal Estimation
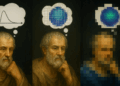
Vertex normal estimation calculates normals for each point in the cloud, crucial for many 3D processing tasks. Viewing normals can be enabled by pressing N, and their length adjusted with - and +. This function computes normals by identifying adjacent points and using covariance analysis to find the principal axis.
A KDTreeSearchParamHybrid instance, specifying a search radius and maximum nearest neighbors, controls the detail of the normal estimation to balance between accuracy and computational load.
print("Recomputing normals for the downsampled point cloud")

# Estimating normals for the downsampled point cloud
downpcd.estimate_normals(
    search_param=o3d.geometry.KDTreeSearchParamHybrid(radius=0.1, max_nn=30))

# Visualization parameters for displaying normals
normals_view_params = {
    "zoom": 0.3412,
    "front": [0.4257, -0.2125, -0.8795],
    "lookat": [2.6172, 2.0475, 1.532],
    "up": [-0.0694, -0.9768, 0.2024],
    "point_show_normal": True
}

# Rendering the downsampled point cloud with normals
o3d.visualization.draw_geometries([downpcd], **normals_view_params)
In the vertex normal estimation code, the operation begins by calling estimate_normals on the downsampled point cloud downpcd. This function calculates normals for each point, which are essential for many 3D processing tasks, such as rendering, simulation, and further geometric analysis. The search_param argument specifies how the normals are computed, using a KD-tree to efficiently find nearby points.
Here, o3d.geometry.KDTreeSearchParamHybrid is configured with a radius of 0.1 and a max_nn (maximum nearest neighbors) of 30. This configuration balances the precision of normal estimation with computational efficiency by limiting the search to a radius of 10cm and considering up to 30 neighbors for each point.
Following the computation of normals, the o3d.visualization.draw_geometries function visualizes the downsampled point cloud with normals enabled.
Takeaways
- Open3D’s Role: Open3D is a crucial library for 3D data processing, enabling complex 3D data manipulation with support for C++ and Python. It facilitates a range of applications from 3D computer vision to AR/VR and robotics.
- 3D Shape Representation: The article explains rasterized and geometric forms as the two primary methods for 3D shape representation. Rasterized forms include multi-view images and volumetric data, while geometric forms cover polygonal meshes and point clouds.
- Point Clouds Fundamentals: Point clouds serve as a simple yet informative form of surface representation, essential for tasks like environmental mapping and object recognition. The article covers the mathematical definition of point clouds and their importance in computer vision and robotics.
- Python Quick Start Guide: A quick start guide to using Open3D with Python is provided, including installation instructions and basic operations like loading, visualizing, and downsampling point clouds, offering a practical introduction to Open3D’s capabilities.
- Practical Use of Open3D: Demonstrating Open3D’s utility, the article provides Python examples for tasks such as point cloud visualization, voxel downsampling, and vertex normal estimation. These examples highlight Open3D’s functionality in processing and visualizing 3D data.
Understanding and processing point clouds is crucial for various applications, and within the context of 3D Computer Vision, the Open3D library provides the necessary tools for these tasks. If you found this post informative, please like, comment, and share to support and spread the knowledge.


Awesome